Jawg Maps is evolving every day
Discover the new features of Jawg Maps : OSM data management, transport network, hillshades, landcover ...


At Jawg, we want to give our customers the best experience when they navigate our maps. That's why every day we strive to improve the services we offer.
The OpenStreetMap data
Always updated
Most of our map data comes from OpenStreetMap (or OSM). OSM is a collaborative and global database which describes the world we live in with billions of entries such as roads, lakes, countries, cities etc.
These data change every day and are also visible on your maps with a delay of about two days.
The OSM data model is not the same everywhere on the planet. That means that sometimes, describing a place may be done in a different way in France than in another country.
Why should we care?
When rendering maps, part of our job is to make sure we get most of those variations under the same data model. Otherwise, our maps would only be displaying part of the real data, which sometimes leads to funny results.
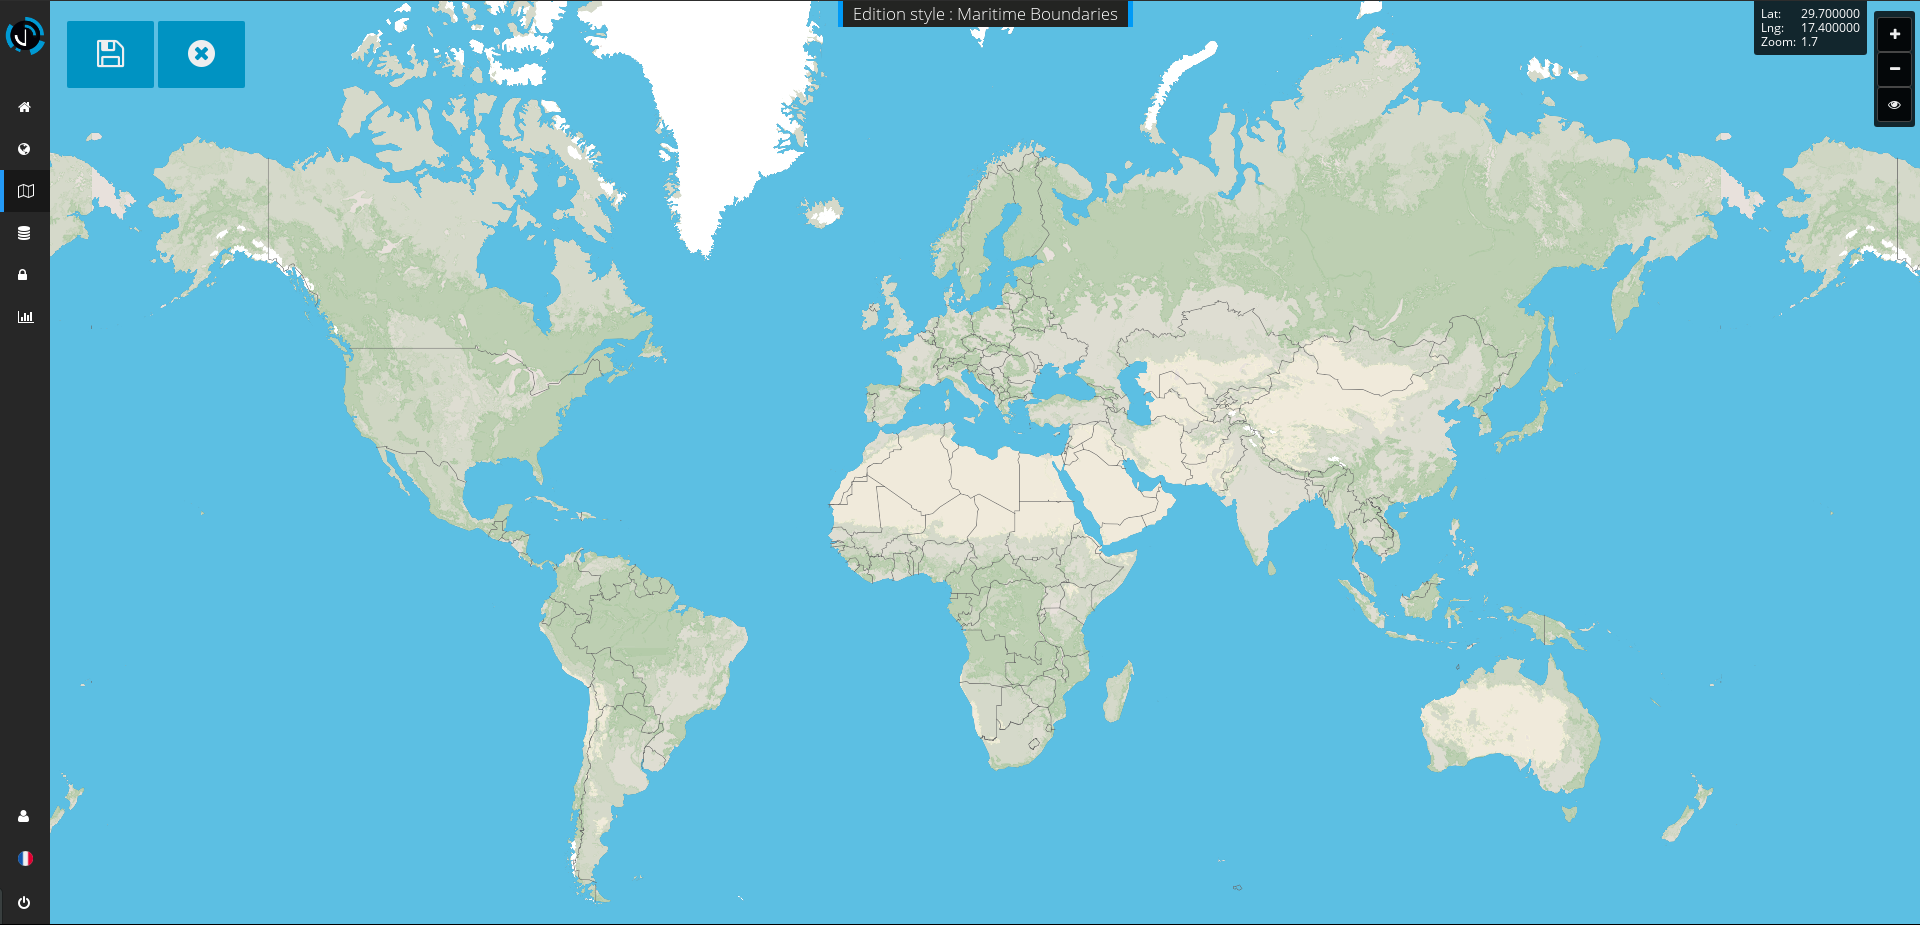
One example comes to my mind, these are the maritime boundaries. Maritime boundaries are an excellent example to show differences in formats.
Maritimes boundaries
Any object that constitutes a map such as buildings, roads, and even boundaries is in fact geo-localized geometries containing properties in key-value form.
In the case of boundaries, we can rebuild them with their admin_level key. Thanks to this, we are able to differentiate a boundarie from a country, a region, a department or even a city. Among these boundaries are those that are terrestrial (between two neighboring countries) or maritime (between a country and international waters).
We have chosen not to display these maritime boundaries on our map for aesthetic reasons. To identify them, there is a key often used, maritime which takes the value yes when the boundary is in the water. However this data model is not always widespread.
In some areas, such as in the Pacific, this data was missing, so we contributed to OSM to improve the data and our map.
In another region, Peru, they have adopted another key-value to represent their maritime boundaries, that is boundary= maritime. We had to ensure that this information is used correctly to always have the perfect display.
Addition of the transport network of some countries
Always for a better quality of our map, we wanted to enrich them by adding the personalized icons of local transport. The available cities are Paris, London, Berlin, Hamburg, Brussels, Madrid as well as all the Russian metros.
These are special rules to integrate knowing that each city and each network has its own rules.
It is still possible to add new cities, if you have an idea you can tweet @jawgio for a new request.
Labels density
Creating a map is not so simple. In the jawg lab, to facilitate access to the general public, we have simplified as much as possible the customization of maps. But in reality, to create a single map, what we do is create as many maps as there are zoom levels.
We must have at each zoom level the information that is really necessary for our users. For example at zoom 2 we will display the names of countries rather than cities. In the same way that we will not display buildings before zoom 16.
We must not consider only what to display on our maps. There is also the amount that needs to be taken into account. We noticed that at certain levels we had a lot of cities that were displayed on our maps. That's why we have done everything to reduce this density of labels and make our maps more readable. This problem was located at two precise zoom levels because the other zooms were correct.
Adding new data, mountains
There is a lot of information stored in OSM and it is sometimes difficult to know what is interesting to put in our maps or not. A person who is dear to us suggested adding mountains and volcanoes to our lists of points of interest and we did it.
So you can admire the volcanoes and mountains on your jawg maps. They are ranked in order of importance (the highest mountains are the most important).
Enrichment via new sources
Always looking for new features, after months of work we were able to release landcovers and hillshades.
Landcovers
Landcovers are the ground cover (sand, vegetation, ice). Organizations that generate them use satellite imagery and apply algorithms on it to deduce the land cover. With this we are able to know where are the urban areas, arid and areas with more or less vegetation.
There are several projects that have created landcover like CORINE LandCover for Europe, GAP National Landcover for USA, GlobCover for the world etc.
From our side, we use these sources and perform some processing to be able to consume them and integrate into our maps.
Hillshades
As for landcover, reliefs or hillshades are derived from satellite imagery. There are also several projects that generate these data like SRTM or ASTER with different coverage.
We already have a great article on it that you can read here.

Conclusion
As can be seen, we work hard at Jawg. We also do everything to satisfy our customers and to have the best experience.
We are also open to all proposals to improve our services.
See you soon on the lab.