Tutorial: How to create a map in the Jawg Lab
Interested in creating beautiful dynamic maps? You’re in the right place! Thanks to our map editor, the JawgLab, you can add or import your data and customize the map to match your brand. But first things first, how do you create a simple map with a dataset? Follow this tutorial to get started.


In this tutorial, we’ll give you a quick overview of the platform and show you how to create and integrate this dynamic map that locates all the beautiful trees in Paris:
Note: this tutorial exists as a video on our YouTube channel: watch the tutorial.
JawgLab Overview
In every section of the Lab, you’ll find a small help window that explains what you can find in that specific section and some best practices or tips.
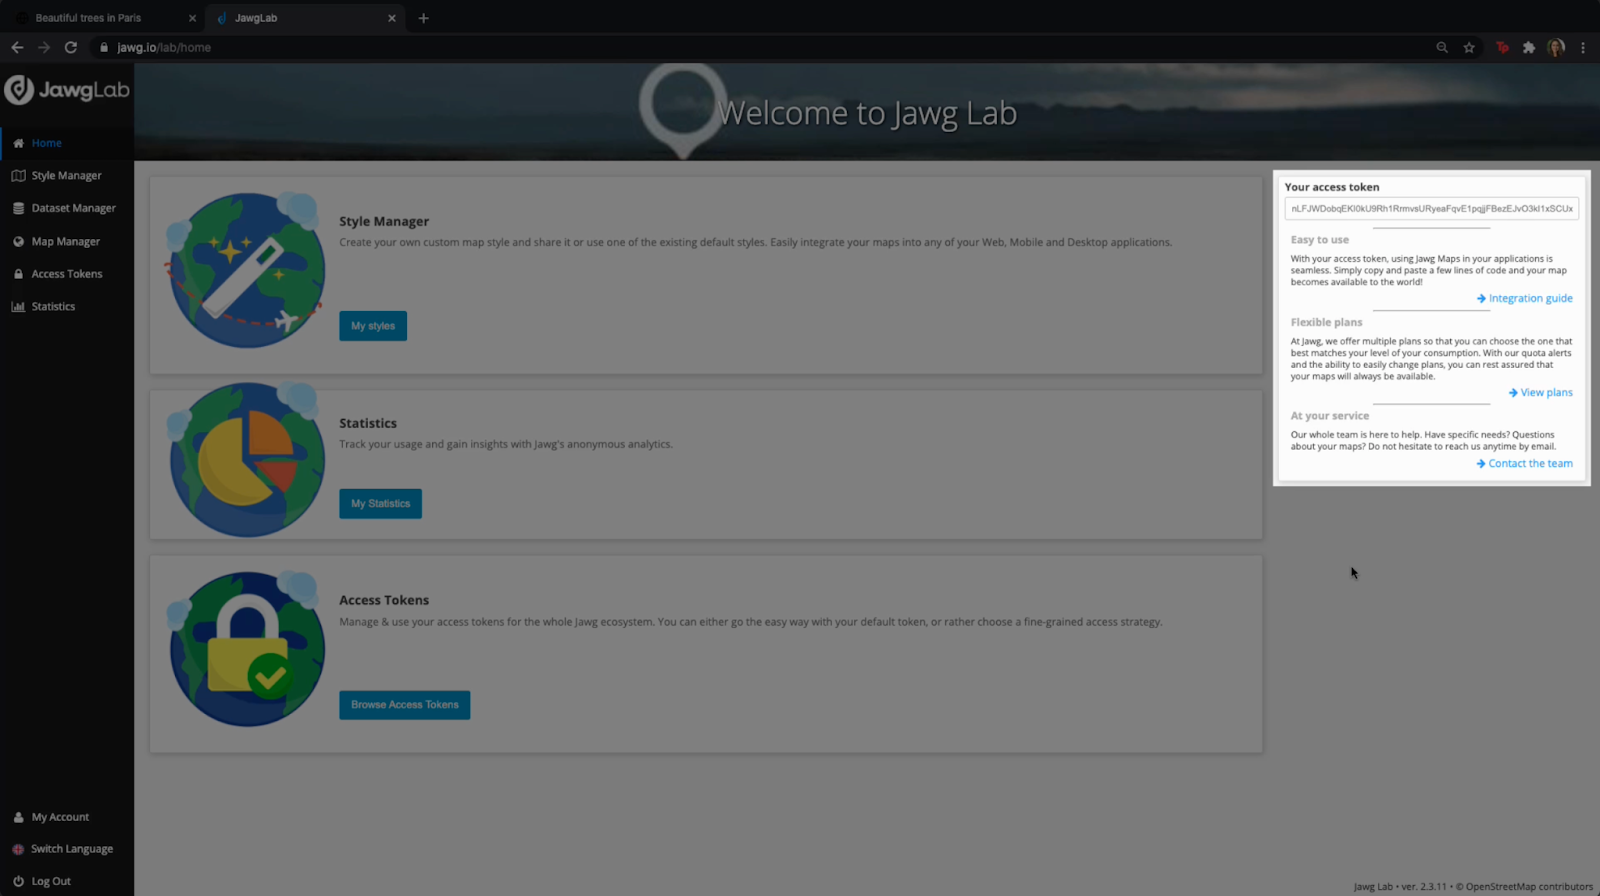
Now let’s look at the different sections listed in the left menu bar:
1. Style Manager: it allows you to create different styles for your maps. Creating a new style can take some time to get just right so you might want to use a pre-built Jawg style to get started.
Watch this tutorial to see how the Style Manager works.
2. Dataset Manager: here you can create a new dataset from the Lab, or import your own dataset from another source.
3. Map Manager: this is where all the magic happens as you combine your map style and your dataset for the final result.
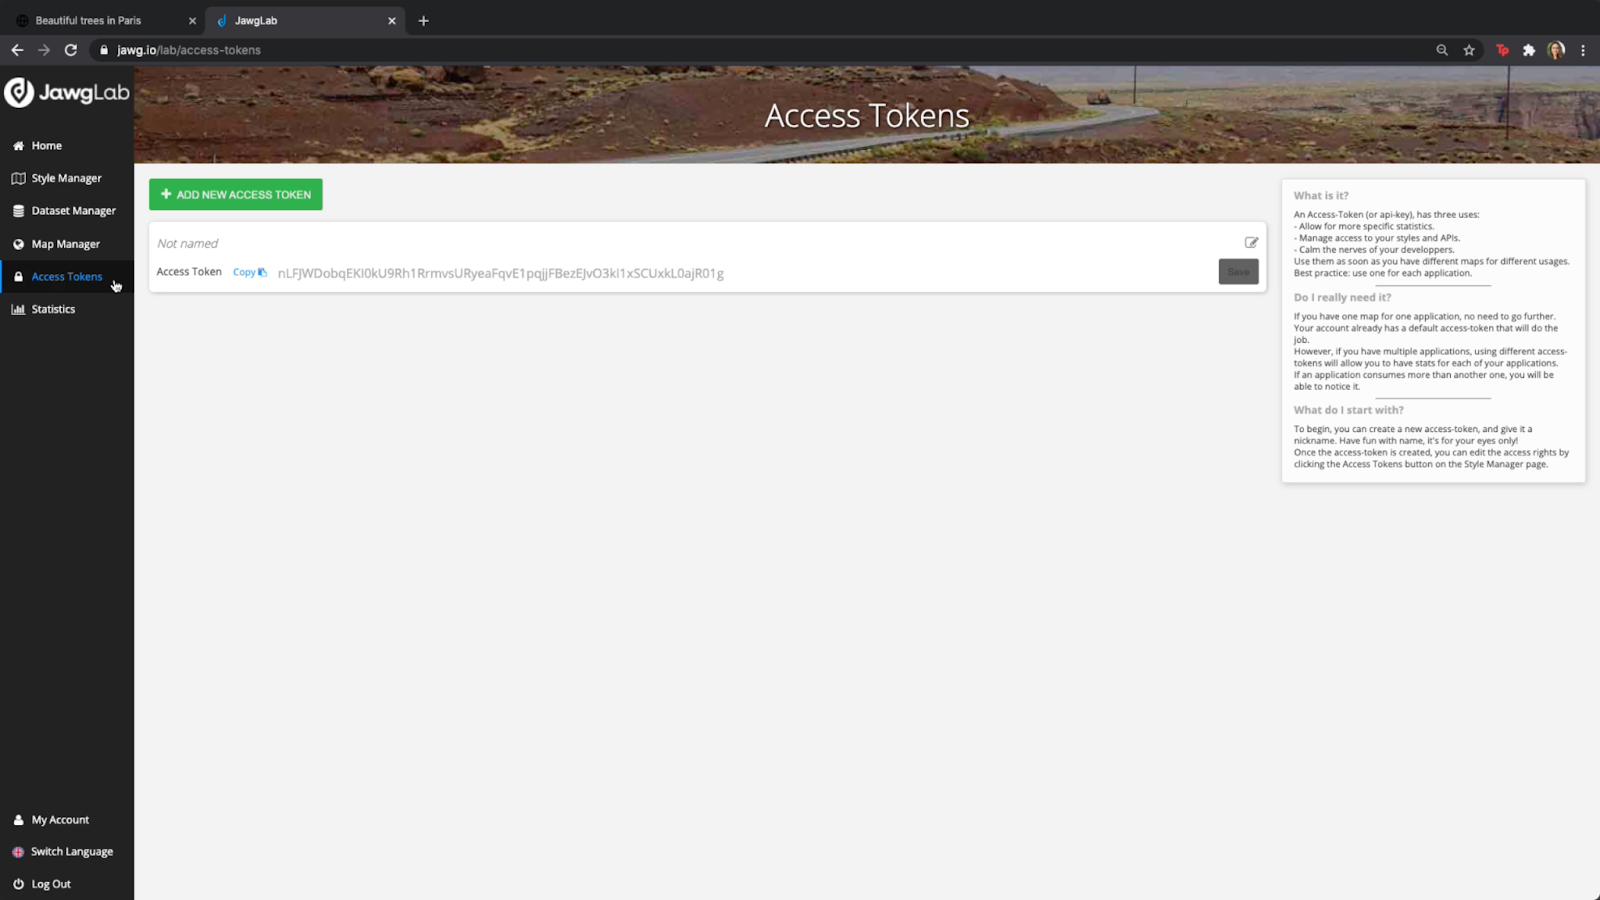
4. Access Token: creating more than one access token can be useful if you’re creating multiple maps or applications and you want to see the stats for each individual application (to see if one consumes more than the other for example). But you don’t need to worry about this if you’re just creating one map for one application.
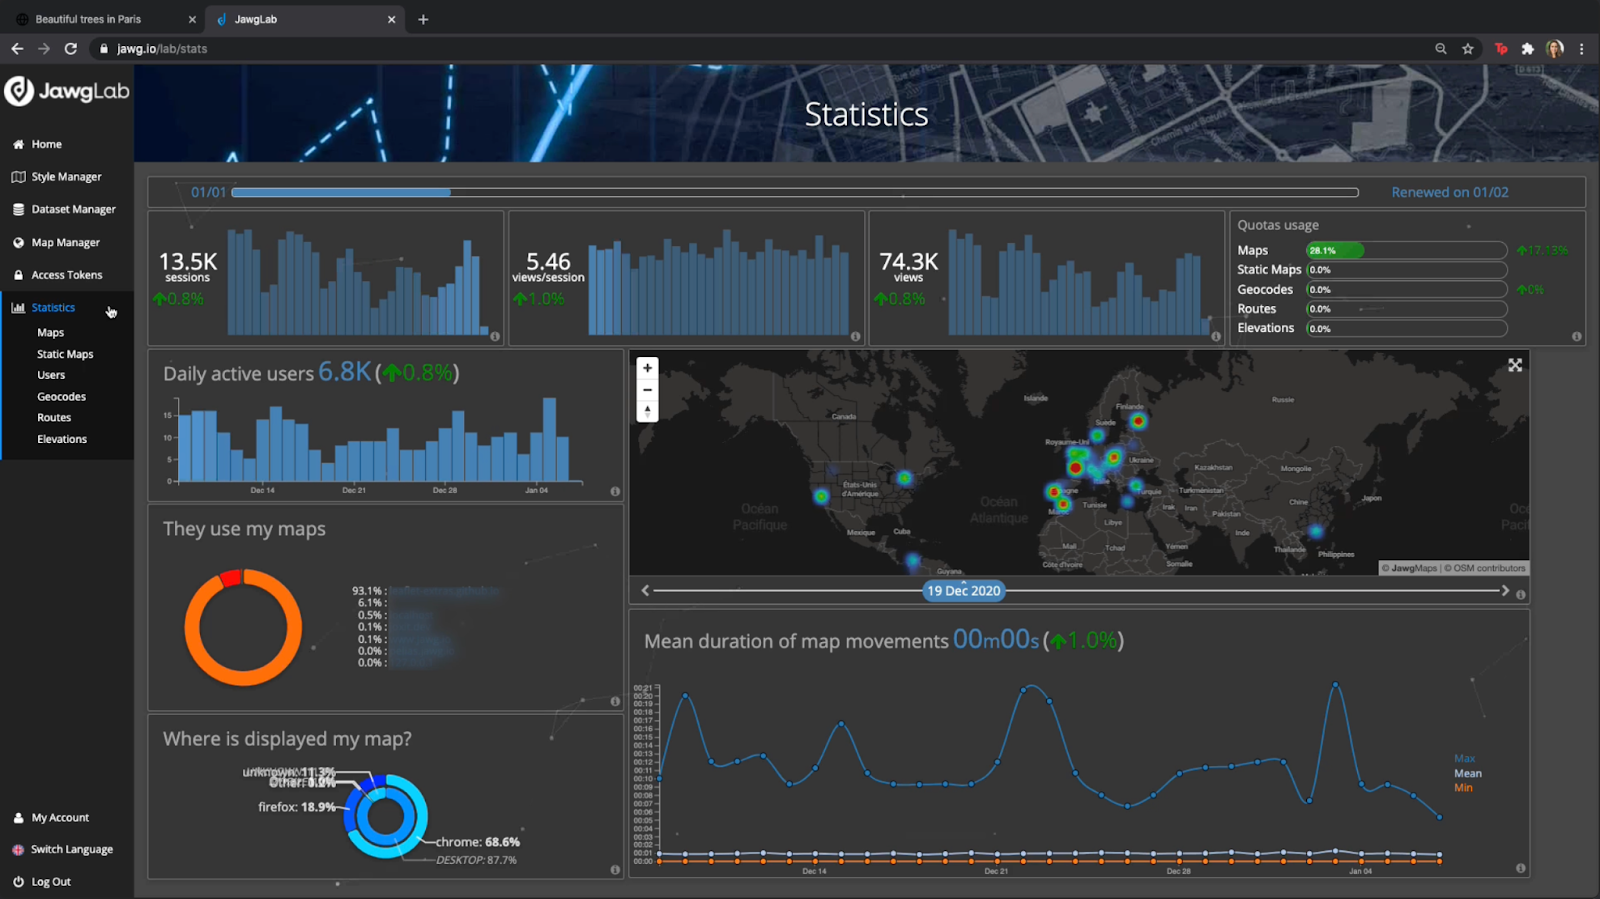
5. Statistics: this section kind of speaks for itself but this is where you would find usage data about your maps.
Alright, let’s create a map!
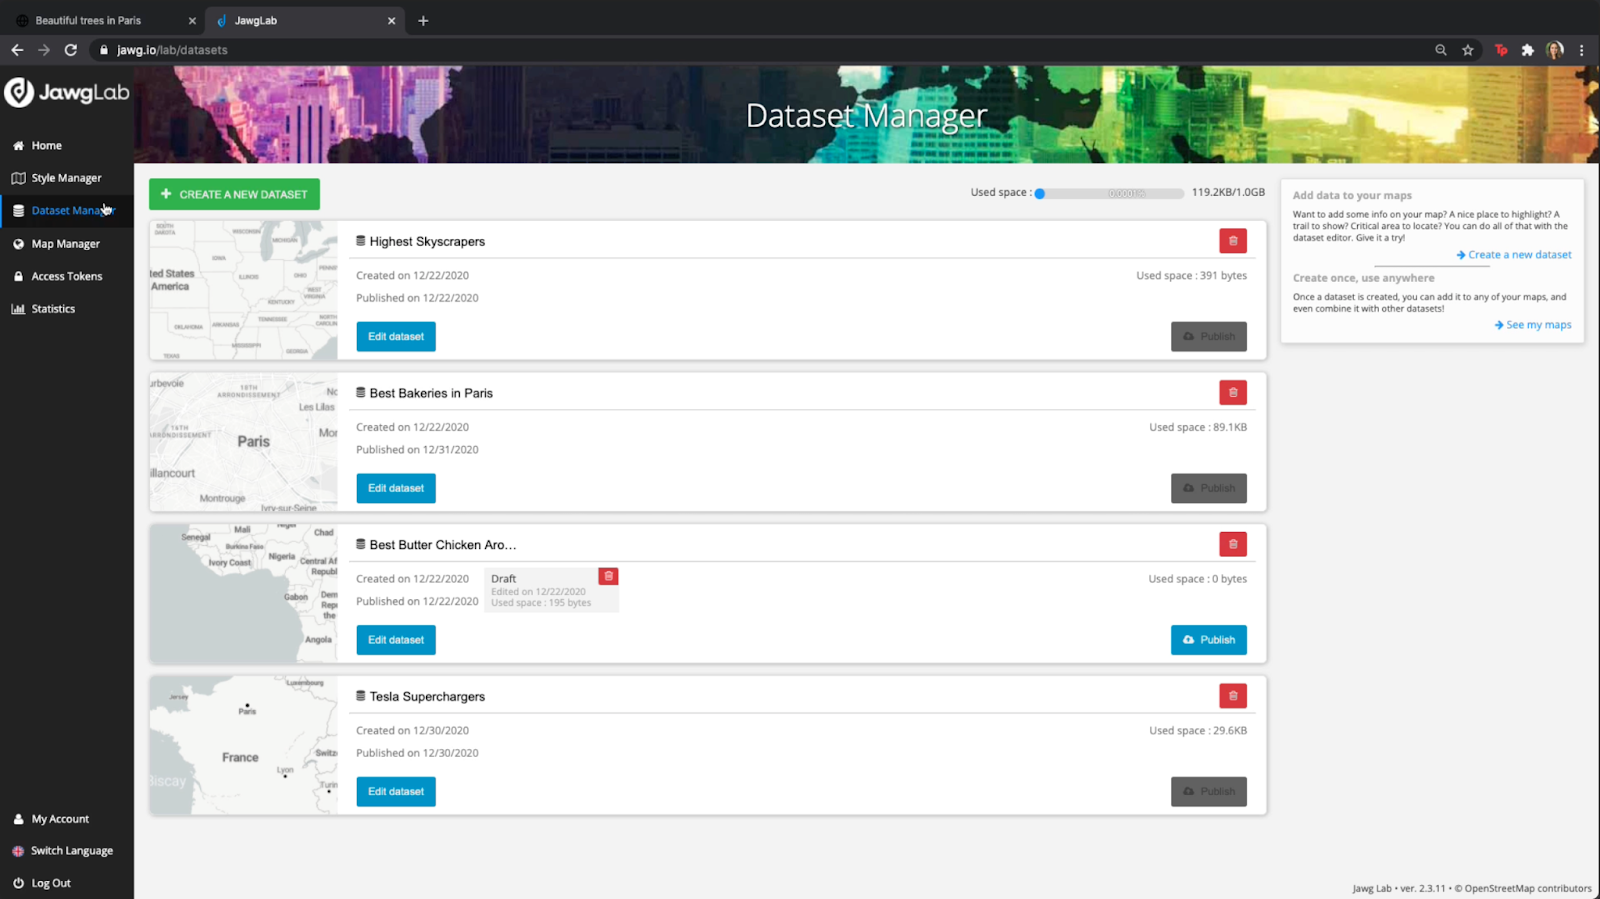
Creating a map
Step 1: Adding your data
What’s the point of creating a map if you’ve got nothing to show on it?
The first step to creating a map is to add your data. To do so, you will need to Create a new dataset and click on the Edit dataset button.
To edit a dataset, you have two options:
- Add data manually
- Import a data file (which must be in a GeoJSON format)
For this example, we’ll be using an existing dataset that locates beautiful trees in Paris so we’ll go with option number 2 and import our GeoJSON file.
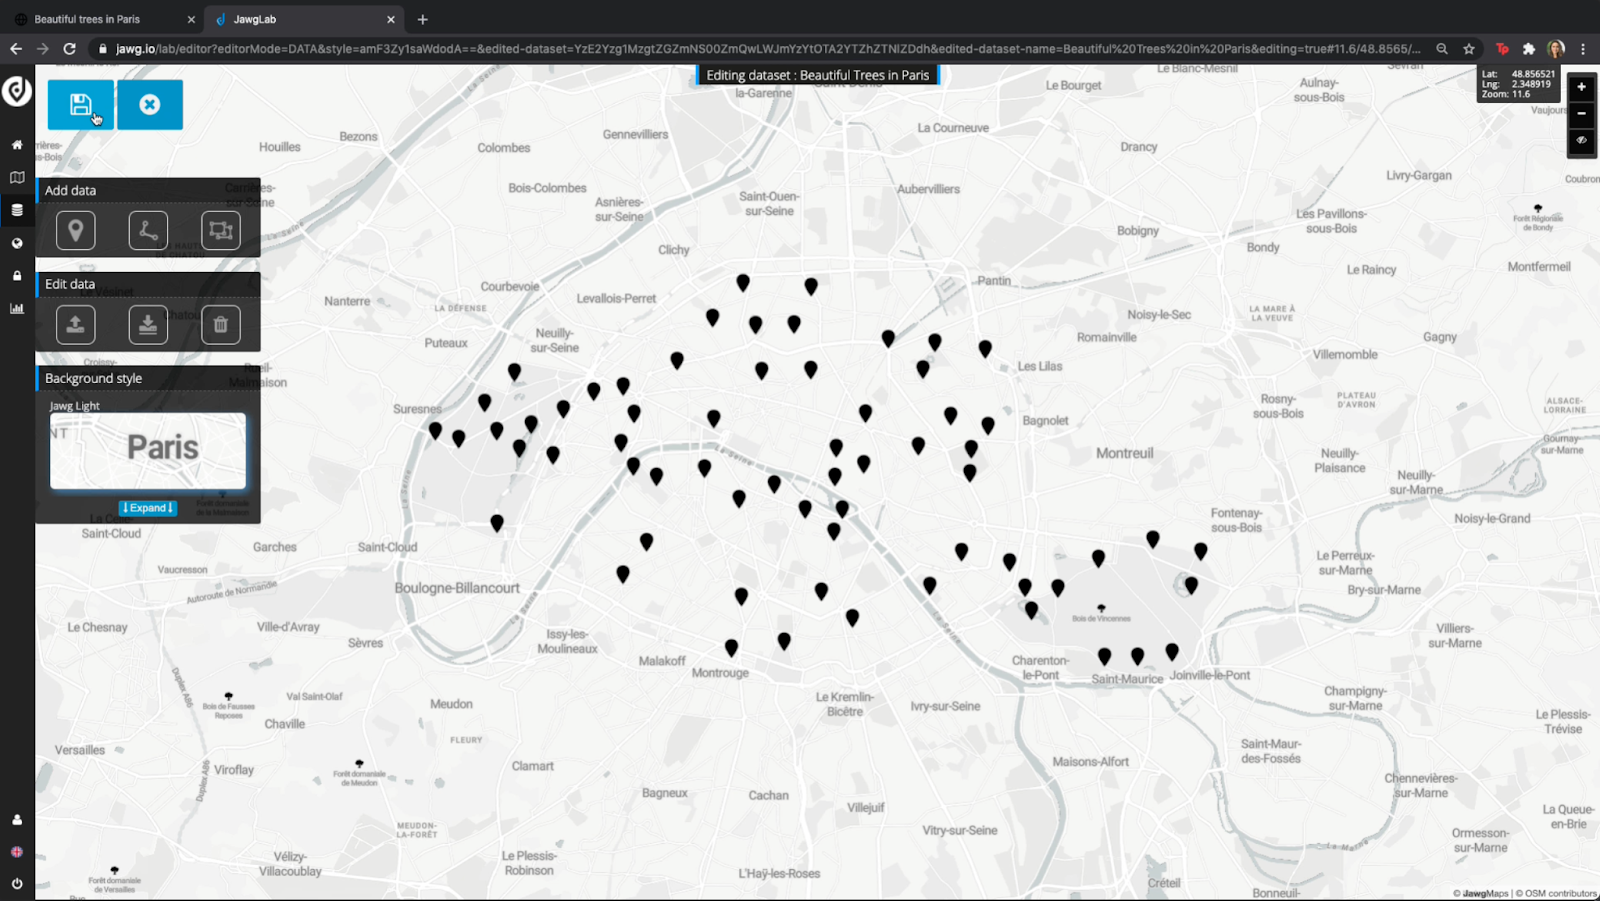
All our data points successfully appear as markers!
Now, let’s Save, Exit and Publish the dataset.
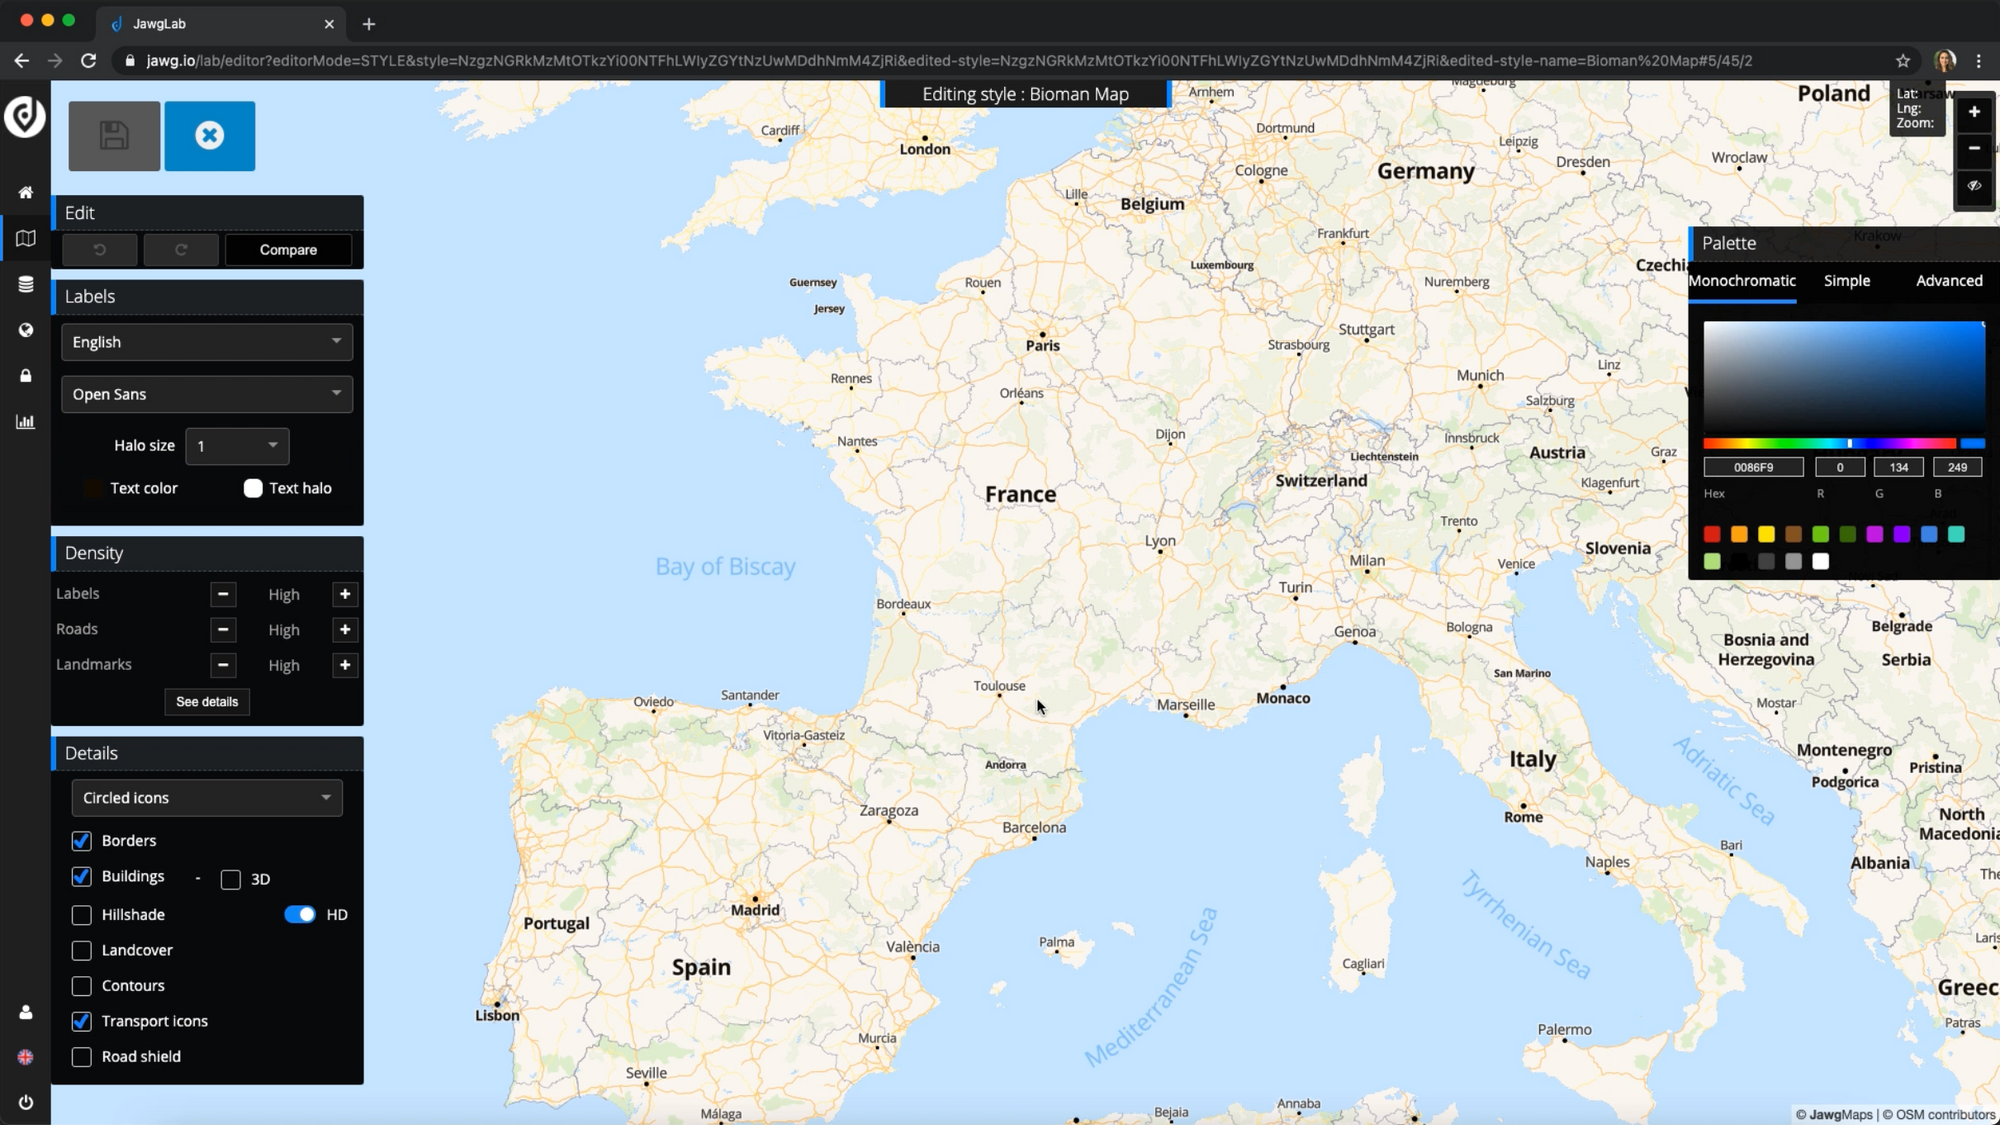
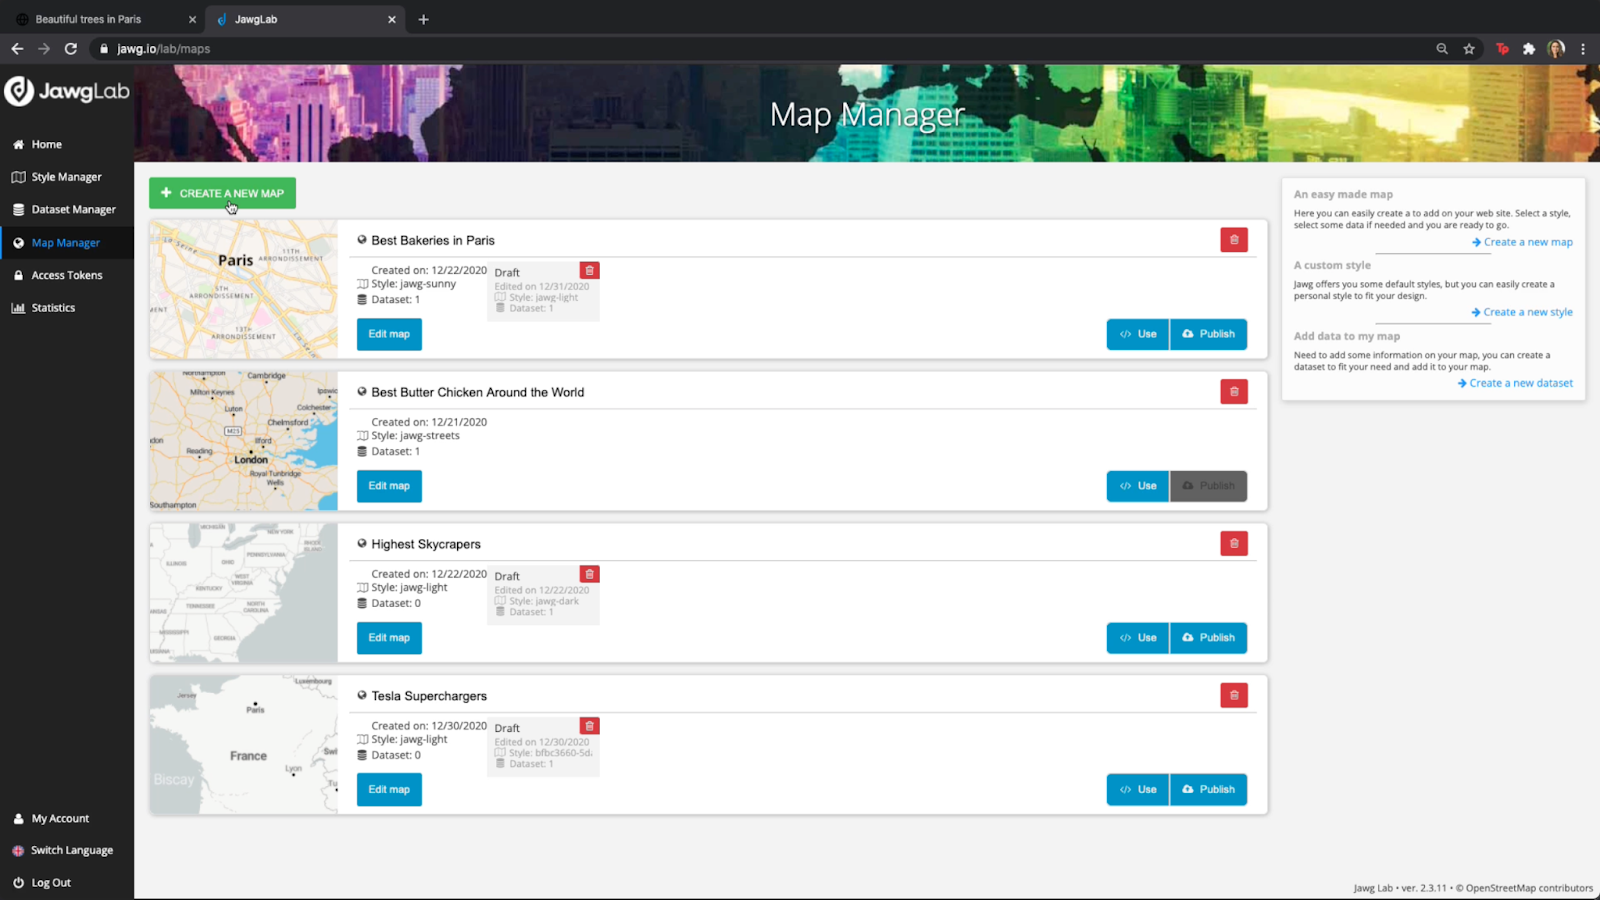
Step 2: Create a map
For this tutorial, we’ll be using a default Jawg map style. If you want to create your own style, you can learn how to in this Style Manager video tutorial.
Let’s open the Map Manager and Create a new map.
We’ll name it Beautiful Trees in Paris.
Then, let's activate our dataset from the right-hand panel. Tadaaa, here are our data points!
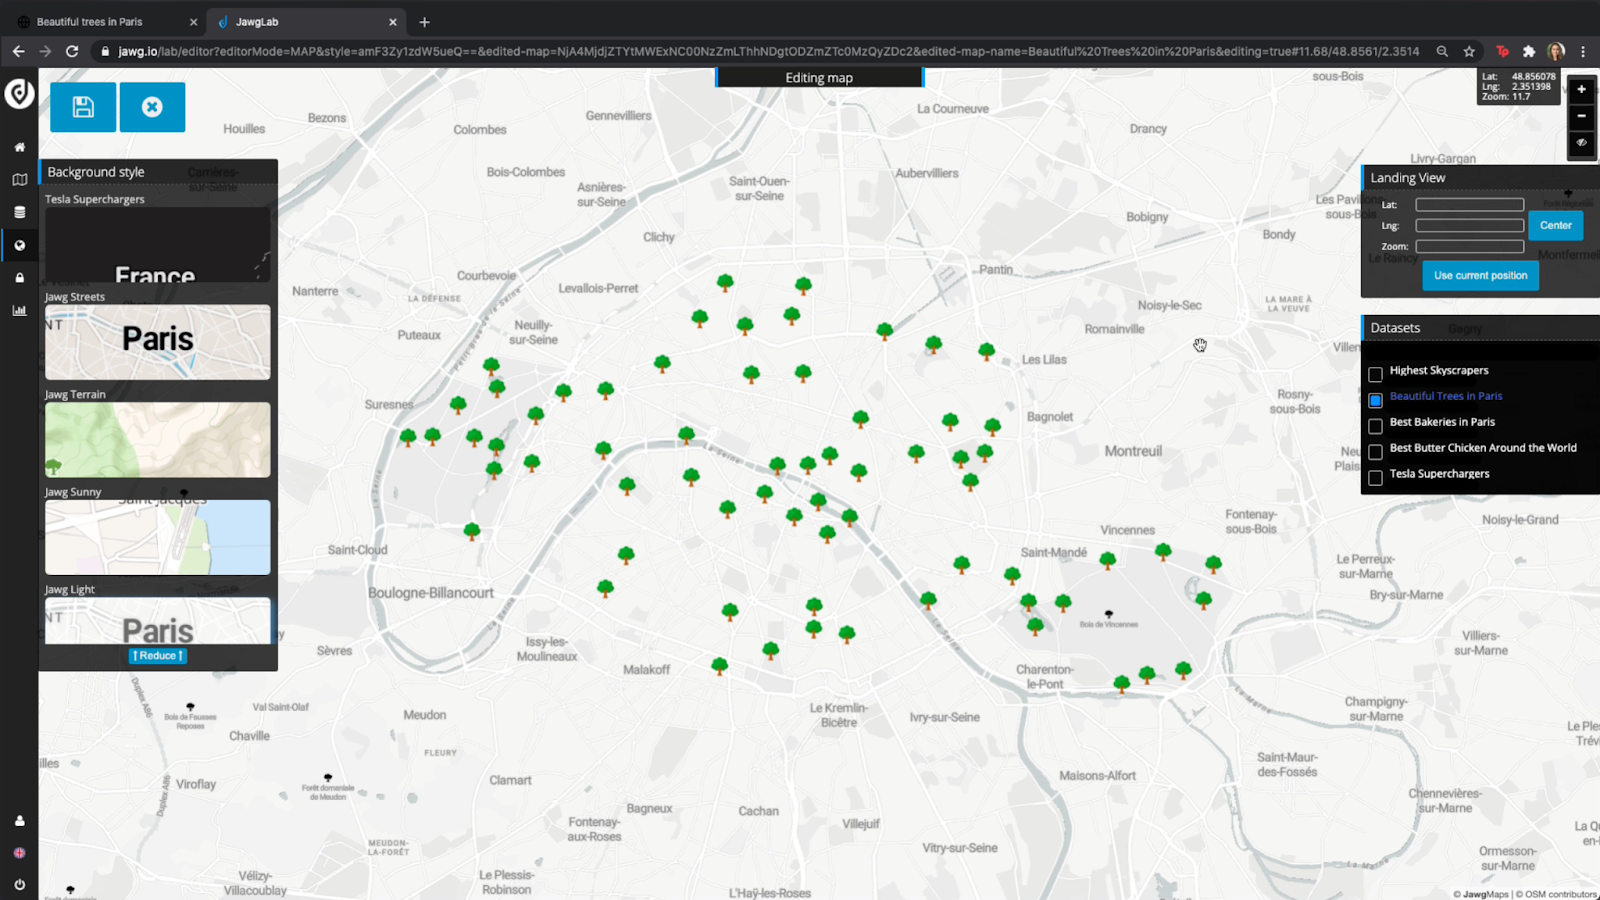
Note: The markers shown use a custom tree icon that can be uploaded in the Dataset Manager.
The current default map style is Jawg Light - which is great when editing your data as it allows you to focus on your data points - but we’re finalising our map and want something a bit more colourful. Let’s pick Jawg Sunny.
To set a Landing View for the map, you can zoom in to your desired frame and click the Use current position button.
All done? Let’s hit Save, Exit and Publish so the changes can go live.
Step 3: Integrate your map
Now that the map is created, you can click the Use button to get the iframe code to integrate into your app or website.
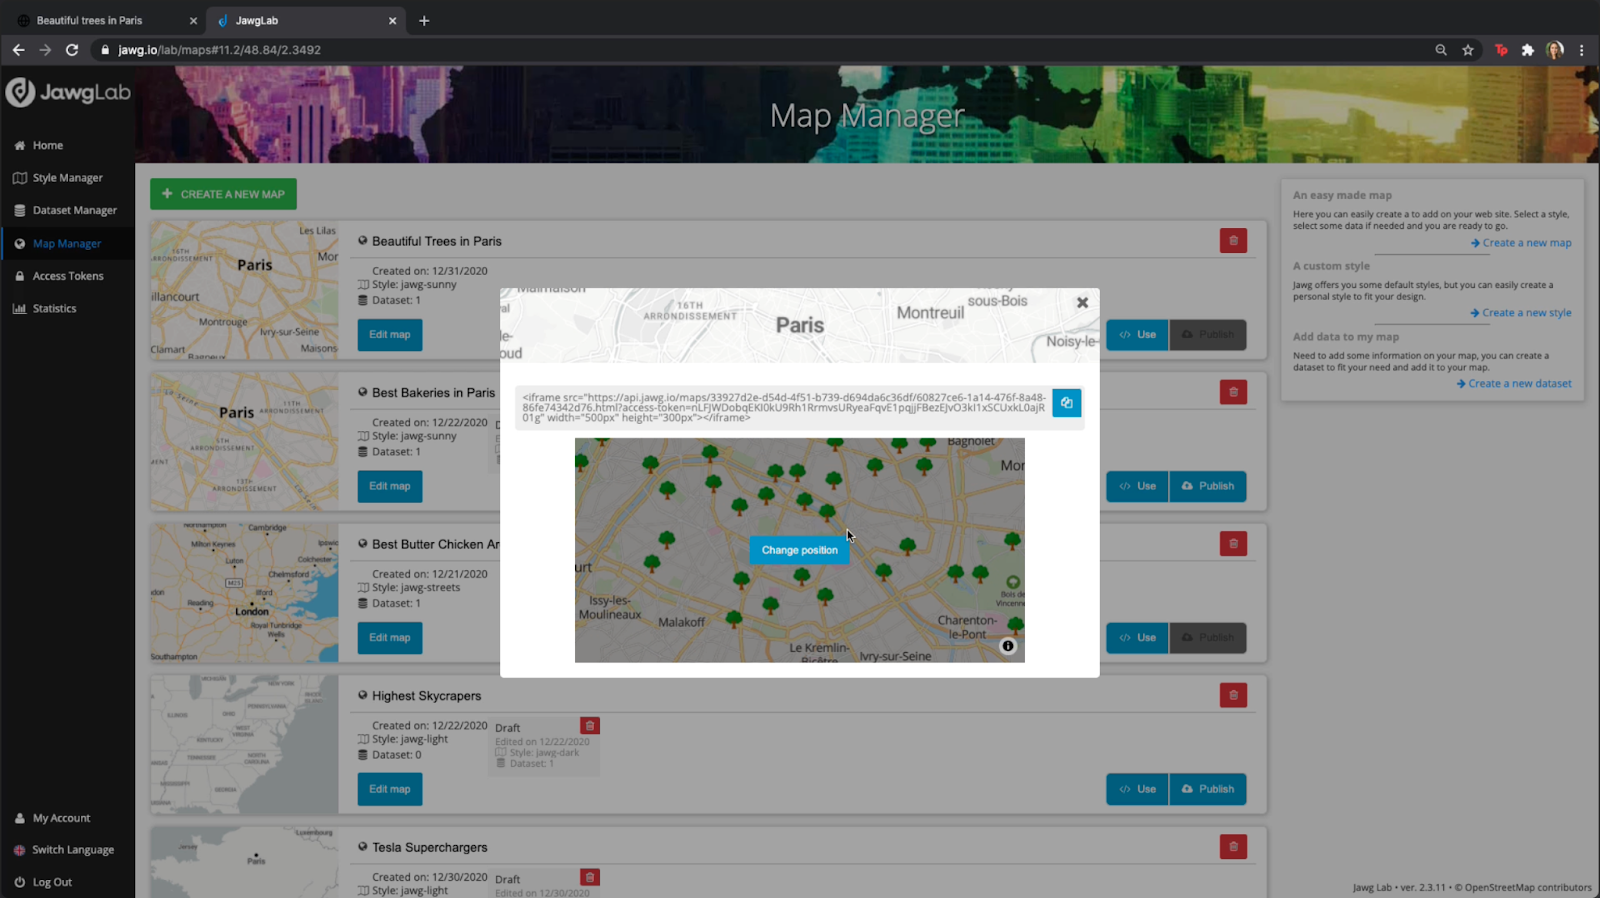
Note: In this view you can also adjust the Landing View by clicking the Change position button.
Final step? Copy and paste the code into your desired webpage!
Thanks for following along and stay tuned for the next Jawg Lab tutorial!
Any questions? Feel free to email contact@jawg.io.
Check out our website for more information on our Maps API.